ajax动态赋值echarts的实例(饼图和柱形图)
网络 2018-03-20 2495
本文以柱形图和饼形图ajax动态赋值为例
一、饼形图赋值步骤
(1)jsp页面
1 2 3 4 5 6 7 | <!-- 引入echarts官方js --> <script src="js/echarts.js"></script> <body> <!-- 为 ECharts 准备一个具备大小(宽高)的 DOM 饼形图 --> <div id="first" style="width: 600px;height:400px;"></div> [html] view plain copy </body> |
(2)js页面
1 2 3 4 5 6 7 8 9 10 11 12 13 14 15 16 17 18 19 20 21 22 23 24 25 26 27 28 29 30 31 32 33 34 35 36 37 38 39 40 41 42 43 44 45 46 47 48 49 50 51 52 53 54 55 56 57 58 59 60 61 62 63 64 65 66 67 68 69 70 71 72 73 74 75 76 77 78 79 80 81 82 83 84 85 86 87 88 89 90 | //饼图模板 var dom = document.getElementById("first"); var myChart = echarts.init(dom); var app = {}; option = null; option = { title : { text: '用户位置记录', subtext: '', x:'center' }, tooltip : { trigger: 'item', formatter: "{a} <br/>{b} : {c} ({d}%)" }, legend: { orient : 'vertical', x : 'left', data:[] }, toolbox: { show : true, feature : { mark : {show: true}, dataView : {show: true, readOnly: false}, magicType : { show: true, type: ['pie', 'funnel'], option: { funnel: { x: '25%', width: '50%', funnelAlign: 'left', max: 1548 } } }, restore : {show: true}, saveAsImage : {show: true} } }, calculable : true, series : [ { name:'', type:'pie', radius : '55%', center: ['50%', '60%'], data:[] } ] }; ; if (option && typeof option === "object") { myChart.setOption(option, true); } //饼图动态赋值 var year = $("#year-search").val(); var mouth = $("#mouth-search").val(); $.ajax({ type: "get", url: rootPath+"/wxbound/getPieDataByMouth.action", data : {"year":year,"mouth":mouth}, cache : false, //禁用缓存 dataType: "json", success: function(result) { var names=[];//定义两个数组 var nums=[]; $.each(result,function(key,values){ //此处我返回的是list<String,map<String,String>>循环map names.push(values.province_name); var obj = new Object(); obj.name = values.province_name; obj.value = values.count; nums.push(obj); }); myChart.setOption({ //加载数据图表 legend: { data: names }, series: { // 根据名字对应到相应的系列 name: ['数量'], data: nums } }); }, error: function(XMLHttpRequest, textStatus, errorThrown) { alert("查询失败"); } }); |
(3)后台代码根据你自己的代码就好
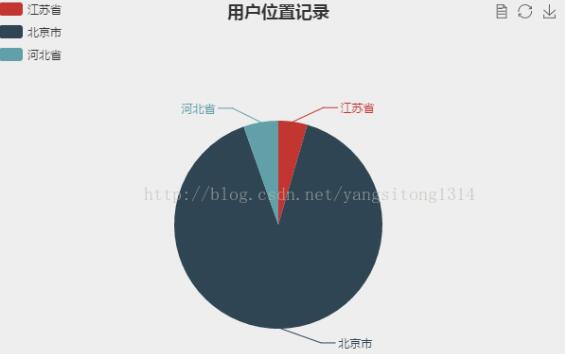
(4)显示样式
二、柱型图赋值步骤
(1)jsp页面
1 2 3 4 5 6 | <!-- 引入echarts官方js --> <script src="js/echarts.js"></script> <body> <!-- 为 ECharts 准备一个具备大小(宽高)的 DOM 柱形图 --> <div id="second" style="width: 600px;height:400px;"></div> </body> |
(2)js页面
1 2 3 4 5 6 7 8 9 10 11 12 13 14 15 16 17 18 19 20 21 22 23 24 25 26 27 28 29 30 31 32 33 34 35 36 37 38 39 40 41 42 43 44 45 46 47 48 49 50 51 52 53 54 55 56 57 58 59 60 61 62 63 64 65 66 67 68 69 70 71 72 73 74 75 76 77 78 79 80 | //柱形图模板 var domLong = document.getElementById("second"); var myChartSecond = echarts.init(domLong); var app = {}; option = null; option = { color: ['#3398DB'], tooltip : { trigger: 'axis', axisPointer : { // 坐标轴指示器,坐标轴触发有效 type : 'shadow' // 默认为直线,可选为:'line' | 'shadow' } }, grid: { left: '3%', right: '4%', bottom: '3%', containLabel: true }, xAxis : [ { type : 'category', data : [], axisTick: { alignWithLabel: true } } ], yAxis : [ { type : 'value' } ], series : [ { name:'直接访问', type:'bar', barWidth: '60%', data:[] } ] }; if (option && typeof option === "object") { myChartSecond.setOption(option, true); } //给柱形图赋值 var year = $("#year-search").val(); $.ajax({ type: "post", url: rootPath+"/wxbound/getWxboundList.action", data : {"year":year}, cache : false, //禁用缓存 dataType: "json", success: function(result) { console.log(result); var linNames=[]; var linNums=[]; $.each(result.lin,function(key,values){ linNames.push(values.mouth); linNums.push(values.count); }); //柱形图赋值 myChartSecond.setOption({ //加载数据图表 xAxis: { data: linNames }, series: { // 根据名字对应到相应的系列 name: ['数量'], data: linNums } }); }, error: function(XMLHttpRequest, textStatus, errorThrown) { alert("查询失败"); } }); } |
(3)后台代码部分根据自己需要就好。。。
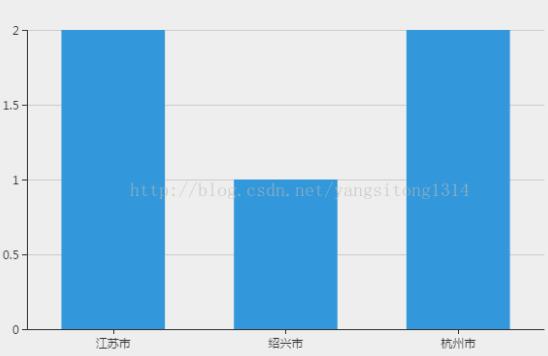
(4)图片样式
可以去试试你的echarts图标了。。。
