Javascript 实现 Excel 导入生成图表功能
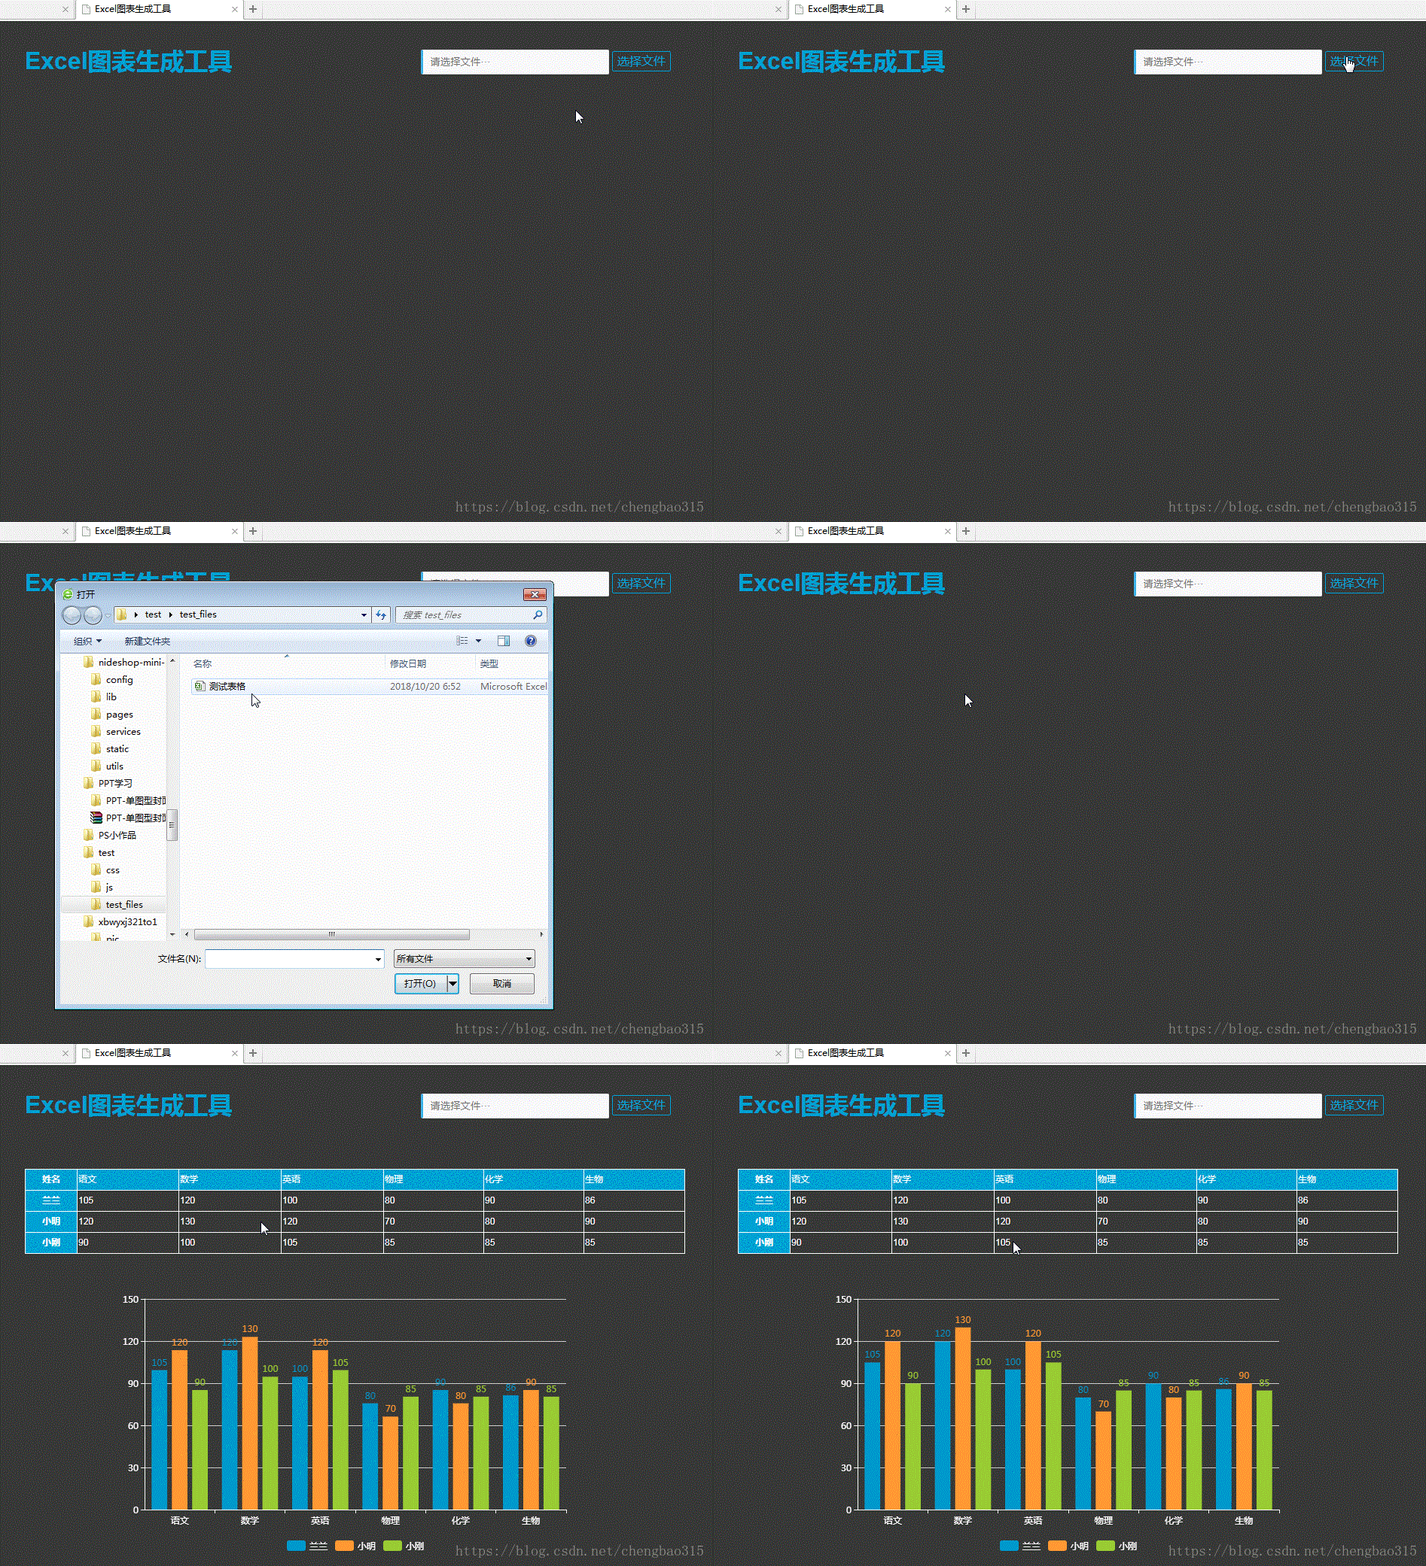
前一段时间做了一个用 JS 实现图表显示的功能,加上这次的Excel 导入功能,最终的效果是这样的:
怎么样?如果看了心动的话,就接着往下看吧。 本次的这个设计需要用到几个插件:jquery.js、xlsx.js、echarts.js,大家需要提前进行下载,之后新建demo.html,demo.js,style.css文件,然后新建一个你想要操作的EXCEL文件,我这里的例子是这样的:
好了,先看HTML代码,引入js,然后使用div布局,代码如下:
1 2 3 4 5 6 7 8 9 10 11 12 13 14 15 16 17 18 19 20 21 22 23 24 25 26 27 | <head> <meta charset="UTF-8"> <meta name="viewport" content="width=device-width, initial-scale=1.0"> <meta http-equiv="X-UA-Compatible" content="ie=edge"> <title>Excel图表生成工具</title> <link rel="stylesheet" href="css/style.css"> <script src="js/jquery.min.js"></script> <script src="js/xlsx.full.min.js"></script> <script src="js/echarts.min.js"></script> <script src="js/demo.js"></script> </head> <body> <div class="barner"> <div class="left"> <h1>Excel图表生成工具</h1> </div> <div class="right"> <input id="select_text" type="text" placeholder="请选择文件···" readonly /> <input id="select_file" type="file" /> <a id="select_btn" href="javascript:void(0);">选择文件</a> </div> </div> <div class="content"> <div id="table"></div> <div id="chart" style="width: 700px; height: 400px;"></div> </div> </body> |
这里需要强调一下,选择文件的 “input” 标签的美化效果,这个标签在css 样式中会隐藏,我用另一个 “a” 链接标签实现点击按钮的作用,后续的效果在 js 代码中实现。
接着看 js 代码, js 中 “a” 标签点击事件中触发 “input” 标签点击事件,然后再给文本赋值,显示文件路径,之后调用导入Excel 方法:
1 2 3 4 5 6 7 8 9 | $(document).ready(function () { $('#select_btn').click(function () { $('#select_file').trigger('click'); }) $('#select_file').change(function () { $('#select_text').val($('#select_file').val()); importf(this); }) }) |
接下来实现导入Excel 方法,定义一个wb变量用于接收读取的EXCEL文档数据,读取过程是调用 xlsx.js 插件 实现的,官方demo中有标准的写法,这里不用纠结为什么这么写,知道这么用就可以,最后通过 XLSX.utils.sheet_to_json()方法可以得到 json 数据。
得到 json 数据后就是原生的 js 语法操作了,我们可以得到一个形如EXCEL表格那样的data 数组,代码如下:
1 2 3 4 5 6 7 8 9 10 11 12 13 14 15 16 17 18 19 20 21 22 23 24 25 26 27 28 29 30 31 32 33 34 35 36 37 38 39 40 41 42 43 44 45 46 47 48 49 50 51 52 | var wb;//读取完成的数据 var rABS = false; //是否将文件读取为二进制字符串 function importf(obj) {//导入 if (!obj.files) { return; } var f = obj.files[0]; var reader = new FileReader(); reader.onload = function (e) { var data = e.target.result; if (rABS) { wb = XLSX.read(btoa(fixdata(data)), {//手动转化 type: 'base64' }); } else { wb = XLSX.read(data, { type: 'binary' }); } // 获取 EXCEL json数据 var jsondata = XLSX.utils.sheet_to_json(wb.Sheets[wb.SheetNames[0]]); var column = []; var data = [column]; for (var key in jsondata[0]) { data[0].push(key); } for (var i = 0; i < jsondata.length; i++) { var row = []; data.push(row); for (var key in jsondata[i]) { data[i + 1].push(jsondata[i][key]); } } // 显示EXCEL 表格 creattable(data); // 显示数据表 getMultiBarChart(data); }; if (rABS) { reader.readAsArrayBuffer(f); } else { reader.readAsBinaryString(f); } } function fixdata(data) { //文件流转BinaryString var o = "", l = 0, w = 10240; for (; l < data.byteLength / w; ++l) o += String.fromCharCode.apply(null, new Uint8Array(data.slice(l * w, l * w + w))); o += String.fromCharCode.apply(null, new Uint8Array(data.slice(l * w))); return o; } |
关于EXCEL表格的实现,我是通过 “table” 标签实现的,在代码中,通过循环操作data 数组数据,形成一个html 代码,最后添加到对应的 div 块中。同时为了显示不同的表头样式,需要添加 id 属性,在css样式中实现样式的操作,代码如下:
1 2 3 4 5 6 7 8 9 10 11 12 13 14 15 16 17 18 19 | function creattable(data) { var _html = " <table>"; for (var i = 0; i < data.length; i++) { _html += "<tr>"; _html += "<th>" + data[i][0] + "</th>"; for (var j = 1; j < data[i].length; j++) { if(i == 0){ _html += "<td id='column'>" + data[i][j] + "</td>"; } else { _html += "<td>" + data[i][j] + "</td>"; } } _html += "</tr>"; } _html += "</table>"; $('#table').append(_html); } |
关于图表功能的实现,是调用 echart.js 插件实现的,在echart 官网,有非常详尽的设计文档和大量的demo可以参考,我们需要做的只是学会各个属性是如何配置的,然后调用 echart 的方法即可,具体实现看代码吧:
1 2 3 4 5 6 7 8 9 10 11 12 13 14 15 16 17 18 19 20 21 22 23 24 25 26 27 28 29 30 31 32 33 34 35 36 37 38 39 40 41 42 43 44 | getMultiBarChart = function (datatable) { var colors = ['#0099CC', '#FF9933', '#99CC33', '#393939', '#f50001', '#fad797', '#59ccf7', '#c3b4df']; var myChart = echarts.init(document.getElementById('chart')); var option = { legend: { bottom: "bottom" ,textStyle:{ color: '#fff' }}, dataset: { source: datatable }, xAxis: [ { type: 'category', gridIndex: 0, axisLine:{ lineStyle:{ color: '#fff' }}} ], yAxis: [ { gridIndex: 0,axisLine:{ lineStyle:{ color: '#fff' }}} ], series: [] }; for (var i = 0; i < datatable.length - 1; i++) { option.series[i] = { type: 'bar', seriesLayoutBy: 'row', label: { normal: { show: true, position: 'top' } }, itemStyle: { normal: { color: colors[i], } }, }; } // 使用刚指定的配置项和数据显示图表。 myChart.setOption(option); } |
讲的这里,我设计的导入EXCEL文件生成图表的功能的全部实现了,关于css 的样式设计,可以参考下面的代码进行设计,不过每个人都有自己的想法,界面如何做的友好,也是前端工程师的一项技能。
1 2 3 4 5 6 7 8 9 10 11 12 13 14 15 16 17 18 19 20 21 22 23 24 25 26 27 28 29 30 31 32 33 34 35 36 37 38 39 40 41 42 43 44 45 46 47 48 49 50 51 52 53 54 55 56 57 58 59 60 61 62 63 64 65 66 67 68 69 70 71 72 73 74 75 76 77 78 79 | body { background-color: #383838; font-family: Arial, sans-serif; line-height: 1.5; color: #464646; } .barner { margin:0 auto; height: 80px; width: 70%; max-width:1100px; } .left{ float: left; color: #00A2D4; } .right{ float: left; margin: 30px 0 0 250px; } #select_text { padding:3px 6px; padding-left:10px; border:1px solid #E7EAEC; width:230px; height:25px; line-height:25px; border-left:3px solid #3FB7EB; background:#FAFAFB; border-radius:2px; } #select_file{ border:0px;display:none; } #select_btn{ color:#00A2D4; padding:4px 6px; border:1px solid #00A2D4; border-radius:2px; text-decoration: none; } .content { margin:50px auto; height: 80px; width: 70%; max-width:1100px; } table { border-collapse :collapse ; margin:0 auto; } th { width:100px; height:25px; border :1px solid white; font-size:12px; text-align :center; color: white; background-color: #00A2D4; } td { width:200px; border :1px solid white; color: white; font-size:12px; text-align :left; } #column { background-color: #00A2D4; } #chart { border-collapse :collapse ; margin:0 auto; } |
总结
以上所述是小编给大家介绍的Javascript 实现 Excel 导入生成图表功能,希望对大家有所帮助
上一篇:js实现动态增加文件域表单功能
下一篇:js实现动态添加上传文件页面


